
Hot water − cold water
THERMAL MANAGEMENT, EXPLAINED
THE SCIENCE
OF COOLING.
Explore airflow, water distribution and evaporative heat transfer. The visualization is an engineering illustration, not a certified design.
RAI / VANILLA 3D DISSECTION
Inside the
cooling tower.
Scroll through an original counterflow model and its major systems. The model is explanatory, not manufacturer CAD or CFD.
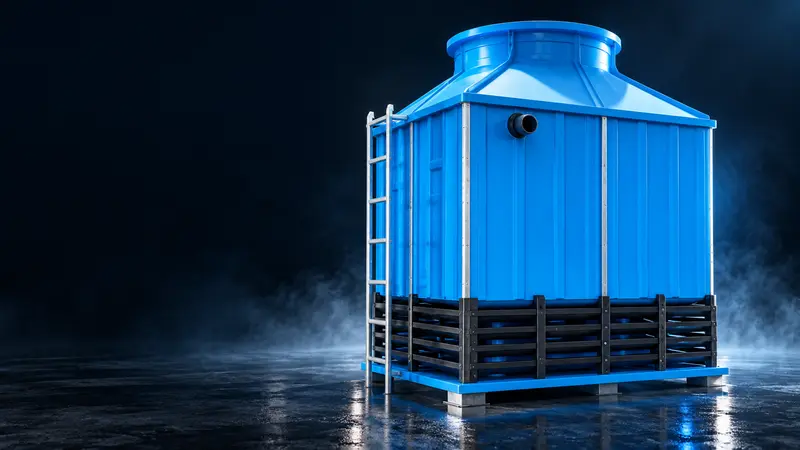
Illustrative model. Interactive 3D loads when needed.
RAI / THE THERMAL EXCHANGE LAB
The science behind
every degree.
Follow the water. Trace the air.
See how a small amount of evaporation carries heat away from an entire industrial process.
OPEN-CIRCUIT COOLING / SECTION VIEW01 / 05
Warm waterAir movementCooled water
Crossflow: side-entry air crosses falling water and exits through the central fan.
UNDERSTAND THE TEMPERATURES
Range is the drop.
Approach is the gap.
Change these illustrative temperatures to see the definitions. This explains the terms; it does not predict a tower’s performance.
37°CHOT WATER32°CCOLD WATER27°CWET BULB
Cold water − entering wet bulb
Wet-bulb temperature reflects the surrounding air’s evaporative cooling potential. A closer approach generally requires a more demanding tower selection.
Example values only. No equipment sizing or guaranteed outlet temperature.
Engineering selection also considers flow rate, heat load, water quality, site layout and operating conditions.
Discuss your operating conditions with RAI ↗RAI / VARIABLE FREQUENCY DRIVE
Set the temperature.
We control the airflow.
Choose the water temperature your process needs. The controller compares it with the measured temperature and adjusts fan speed automatically. By avoiding unnecessary full-speed operation, the system can reduce fan power during part-load conditions. When the water reaches your desired temperature, the fan stops.
FAN CONTROL EXPLORERINTERACTIVE DEMONSTRATION
COOL TO SETPOINT / AUTOMATIC FAN STOP
Change either temperature to see the controller adjust the fan automatically.
TEMPERATURE-BASED AUTOMATIC CONTROL
LIVE COOLING SIMULATIONCooling water · Fan running
Time-compressed demonstration. Cooling time and speed response are illustrative.Temperature above setpoint
AUTOMATIC FAN SPEED
Following temperature demand
Following temperature demand
Assumes a 50 Hz base frequency
Fan-law model: airflow ∝ speed
WHY VARIABLE SPEED MATTERS
A small speed change.
A different power curve.
For an idealized fan under similar conditions, airflow scales with speed while shaft power scales approximately with its cube.
%RELATIVE FAN SHAFT POWER
0.60 × 0.60 × 0.60 ≈ 0.216
Relative airflowRelative shaft power
Normalized to 100% speed. Electrical input, drive losses and real operating conditions affect actual power. This is not a site energy-savings forecast.
FROM FEEDBACK TO AIRFLOW
Inside the control loop.
Select a stage to understand its role.
01 / INPUT
Measure the returning result.
A temperature sensor measures the cooled-water condition. This feedback lets the controller respond to the system instead of leaving the fan at a fixed command.
- Sensor location and calibration affect the quality of the feedback.
- The target temperature comes from the process requirement.
ENERGY-SAVING OPERATION
Run the fan only
when cooling demands it.
RAI variable-speed control reduces airflow at part load instead of wasting energy at a fixed full-speed command.
%ILLUSTRATIVE FAN-POWER REDUCTION VS FULL SPEED
This is a fan-power comparison at the current operating point, not a guaranteed annual site-energy saving. Actual results depend on load profile, controls, motor, drive, water conditions and operating hours.
Discuss an energy-saving control system ↗PUT THE SAVING IN YOUR NUMBERS
FAN POWER AVOIDED kW
ESTIMATED ENERGY AVOIDED MWh/year
Illustrative estimate based on the current fan-speed demand and your reference inputs. Final savings require measured load, motor, drive, water conditions and operating hours.
RAI / SYSTEM CONFIGURATIONS
Three ways to connect.
One continuous process.
Explore the tower, tanks and machine as a complete circuit. Rotate each 3D layout, inspect its equipment and individual parts, or separate the assembly to see how everything fits together.
Two circuits. One common basin.
The machine circuit and cooling-tower circuit both connect to the same RCC basin.
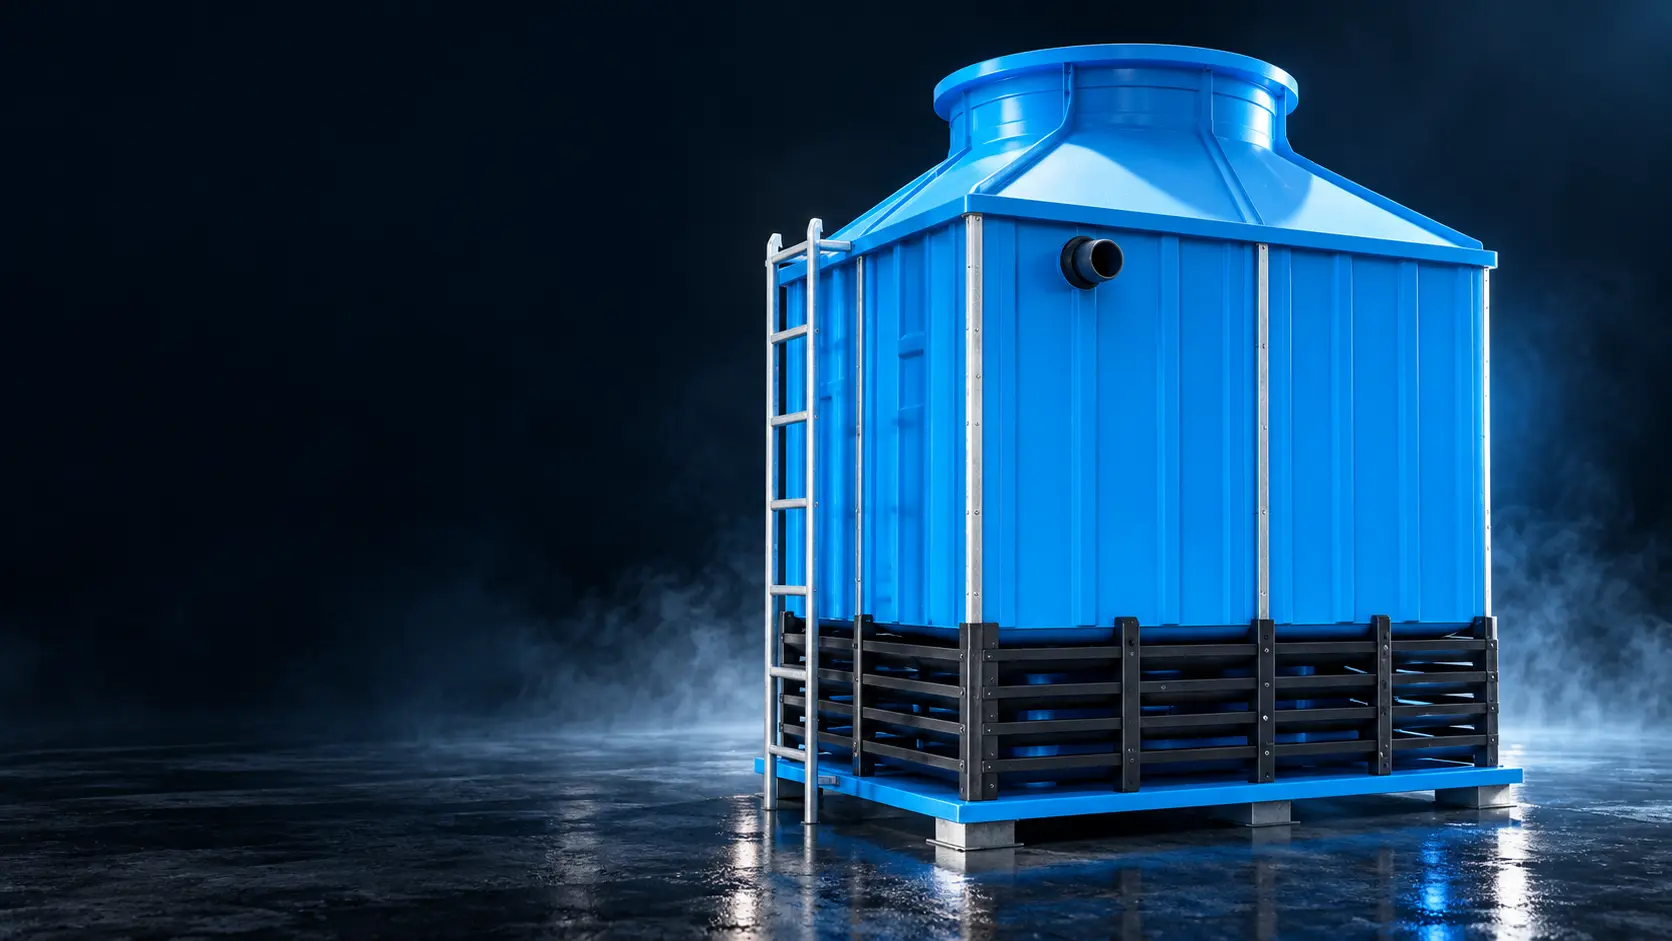
● Warm return● Cooled supply● Basin circulationArrowheads indicate direction
The original explanatory layout is available while the interactive view loads.
Illustrative arrangement developed for explaining process connections. Equipment sizes, pump selection and pipe routing are project-specific.
EFFICIENCY BY DESIGN
RELIABILITY BY
ENGINEERING.
Thermal performance
Tower configuration, fill and water distribution are selected around the required heat rejection.
Energy-conscious operation
VFD fan control can adjust operation to changing cooling demand, where configured.
Serviceability
Access, modular cells and maintenance requirements influence design choices.
Lifecycle thinking
Material selection, water management and upkeep matter over the equipment lifecycle.